
Higher returns with lower risk
A family office investing in Gary Antonacci’s Enhanced Dual Momentum
What Is Dual Momentum?
- We use Momentum applied to stock indices using ETFs.
- When stocks fall we switch to the safety of bonds, again using ETFs.
- We also move between U.S. and Non-U.S. stocks according to global maco-economic trends.
There are many advantages to Dual Momentum
- It has the advantage of greater scalability and lower transaction costs;
- Momentum with stock indices outperforms momentum with individual stocks even before trading costs.
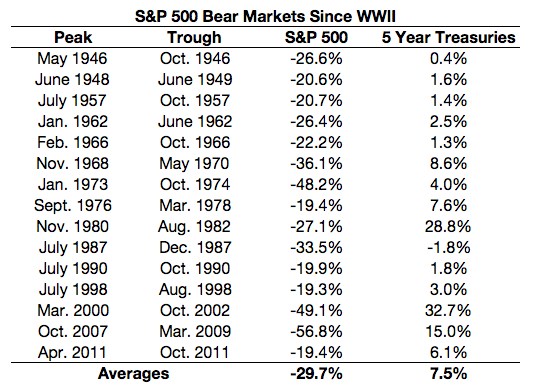
- Bond prices usually rise when stocks prices go down.
- The Fed tends to lower interest rates when stocks are weak which helps support bond prices.
- The figures opposite show how bond prices remain stable or increase during bear markets.
We use relative strength to select the best performing assets and absolute momentum to invest only when the trend in those assets is positive. The way we use relative strength is as follows: ……………..Absolute momentum is blah blah and they way we use this is blah blah
The Sunwise Story So Far
We began Sunwise March 2020 with a 100% investment in Eurobond (?). This rose 3% until June 5th when we switched into
Sunwise Products
| Public | Proprietary |
| Global Equities Momentum (GEM) | Enhanced Global Equities Momentum (E-GEM) |
| Enhanced Global Balanced Momentum (E-GBM) | |
| Global Conservative Momentum (GCM) | |
| Dual Momentum Fixed Income (DMFI) |
Dual Momentum Fixed Income (DMFI)
Dual momentum works as well with bond indices as it does with stock indices. DMFI applies dual momentum to short and intermediate-term bond funds. This lets investors profit from rotational strength in different sectors of the bond market.
Enhanced Global Equities Momentum (E-GEM)
E-GEM is an enhanced version of our public GEM model. E-GEM includes improved logic for deciding when to be in stocks or bonds and a wider selection of stock and bond funds. E-GEM is for aggressive investors willing to accept the short-term volatility of an all-stock portfolio under normal market conditions.
Enhanced Global Balanced Momentum (E-GBM)
E-GBM is a balanced allocation of 80% E-GEM and 20% DMFI. E-GBM is for investors with a moderate risk tolerance. It is a general-purpose model suitable for those wanting permanent exposure to both stocks and bonds using dual momentum.
Global Conservative Momentum (GCM)
Global Conservative Momentum (GCM) is a more conservative allocation of 60% E- GEM and 40% DMFI. GCM is for investors with a lower risk tolerance such as those at or near retirement age.
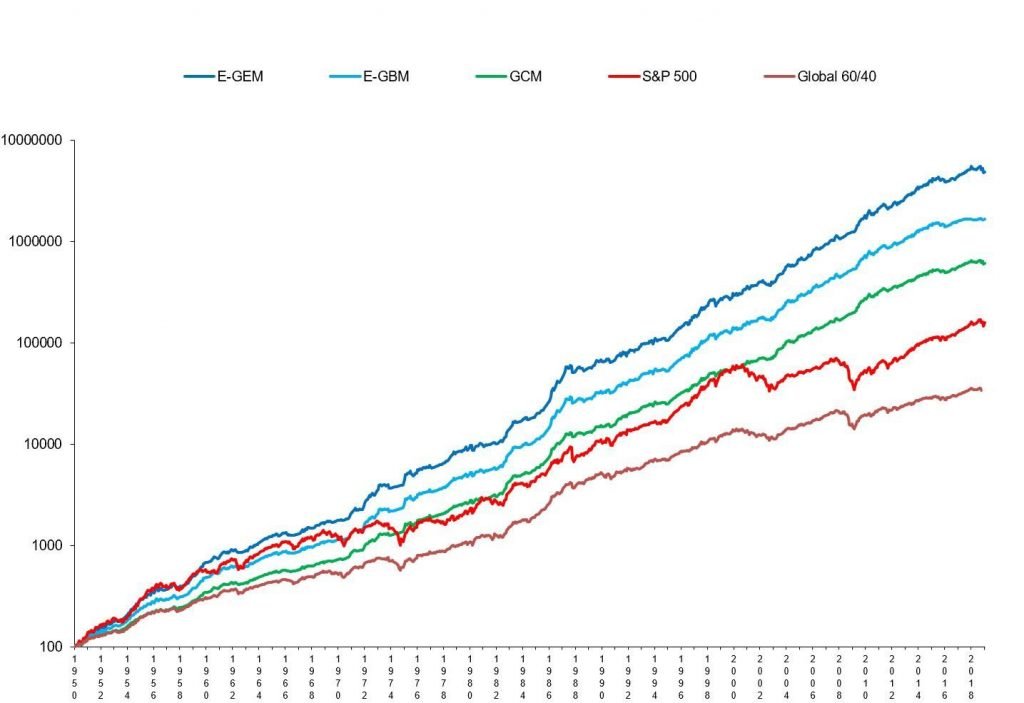
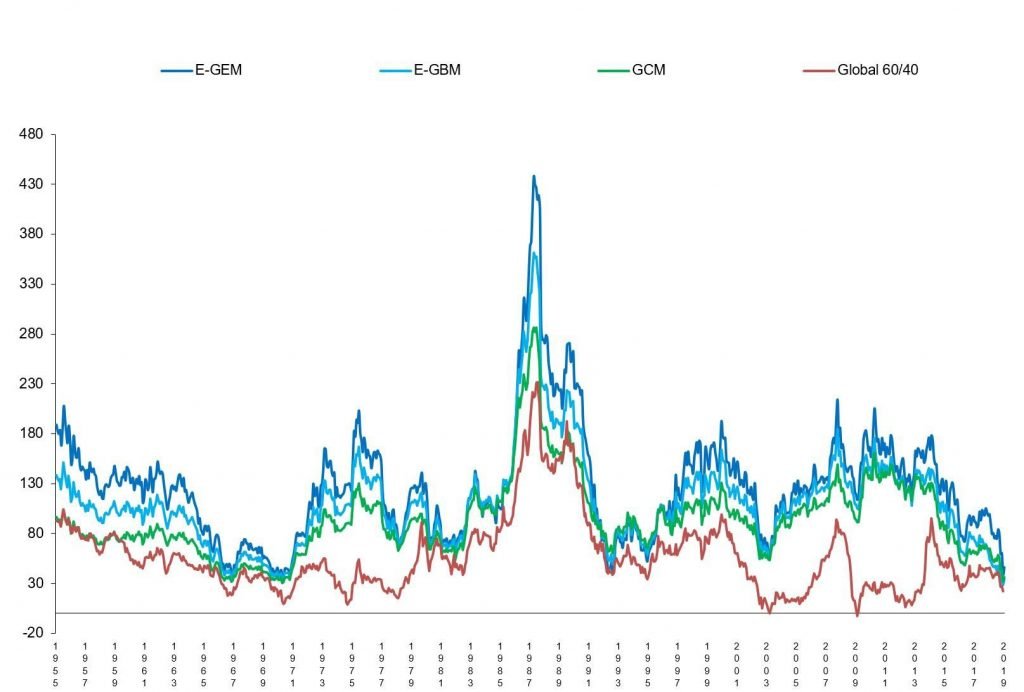
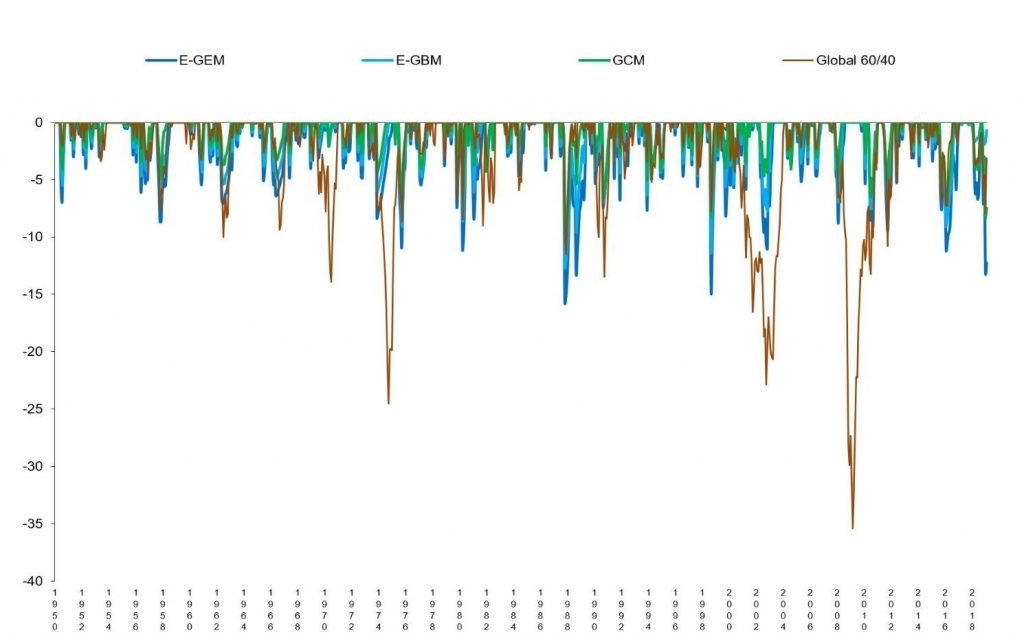
Proprietary Models Performance – January 1950 through Dec 2019
| E-GEM | E-GBM | GCM | S&P 500 | Global60/40 | |
| CAGR | 16.7 | 15.0 | 13.4 | 11.4 | 8.8 |
| Standard Deviation | 10.9 | 9.0 | 7.3 | 14.3 | 8.6 |
| Sharpe Ratio | 1.09 | 1.14 | 1.19 | 0.54 | 0.56 |
| Worst Drawdown | -16.8 | -13.2 | -9.7 | -51.0 | -35.4 |
| Worst 12 Months | -12.0 | -9.8 | -7.6 | -43.3 | -31.0 |
| % of Up Months | 73 | 74 | 75 | 64 | 65 |
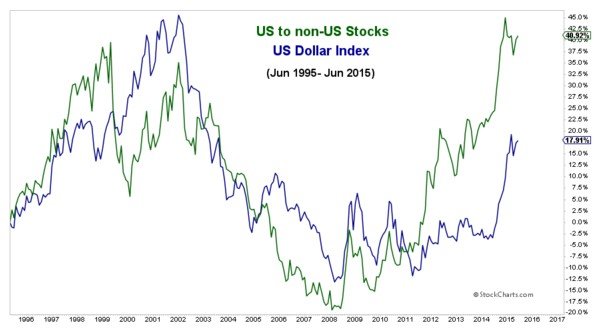
There is also a tendency for asset correlations to rise sharply during times of market stress.2 Diversification fails to provide protection when it is needed the most. Our dual momentum models use stock index ETFs as their core holding because stocks have had the highest long-run risk premium of any asset. We move between U.S. and non-U.S. stocks according to global macro-economic trends. This rotational strength creates high expected returns in bull market environments.
Our models exit stocks for the safety of bonds when stocks become weak. This is the best time to be in bonds. Bond prices usually rise when investors flee stocks for the relative safety of bonds. The stock market is a leading economic indicator. The Fed tends to lower interest rates when stocks are weak and the economy faces recession. This also helps support bond prices.
Momentum has outperformed buy-and-hold now for over 200 years.3
Our dual momentum approach uses relative strength to select the best performing assets. It uses absolute momentum to invest only when the trend in those assets is positive.
In 2010 we began using proprietary dual momentum strategies. We have been licensing these to other investment professionals since 2012. These proprietary models are more adaptive to market conditions. For example, the current bull market in stocks began in March 2009. The public version of dual momentum did not reestablish long positions in stocks until November. But our proprietary models went long in May.
Initial model testing of dual momentum went back to 1974. With the acquisition of more data, our backtested model results now go back to 1950.
Current Dual Momentum Models
Proprietary model investors benefit in other ways. Proprietary models scale in and out of their positions. They use DMFI to select the best bond funds when they out of the stock market instead of using a single bond index. Proprietary model investors receive regular email reports with relevant news, research updates, and market commentary.
Results are not a guarantee of future success and do not represent returns that any investor actually attained. Indexes are unmanaged, do not reflect management or trading fees, and one cannot invest directly in an index. CAGR is the compound annual growth rate. Global 60/40 is 60% MSCI All Country World Index and 40% Barclays Capital U.S. Aggregate Bond Index. Worst drawdown is on a cumulative month-end basis. Correlations are based on monthly returns. Please see the Disclaimer at the end of this document for additional information.
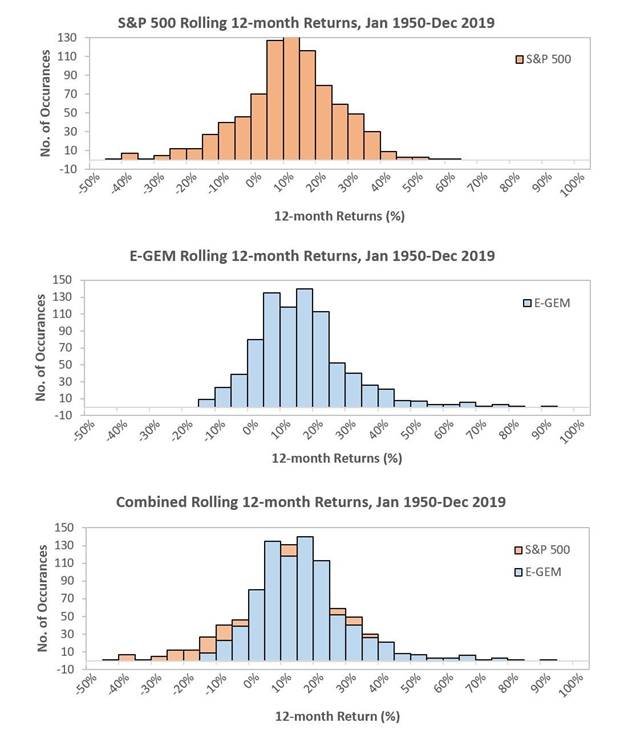
Rolling 12-Month Returns – January 1950 through Dec 2019
Results are not a guarantee of future success and do not represent returns that any investor actually attained. Indexes are unmanaged, do not reflect management or trading fees, and one cannot invest directly in an index. CAGR is the compound annual growth rate. Global 60/40 is 60% MSCI All Country World Index and 40% Barclays Capital U.S. Aggregate Bond Index. Worst drawdown is on a cumulative month-end basis. Please see the Disclaimer at the end of this document for additional information.
Performance Comparisons – January 1950 through Dec 2019
Results are not a guarantee of future success and do not represent returns that any investor actually attained. Indexes are unmanaged, do not reflect management or trading fees, and one cannot invest directly in an index. CAGR is the compound annual growth rate. Global 60/40 is 60% MSCI All Country World Index and 40% Barclays Capital U.S. Aggregate Bond Index. Worst drawdown is on a cumulative month-end basis. Please see the Disclaimer at the end of this document for additional information.
Rolling 5 Year Returns – January 1950 through Dec 2019
Drawdowns from Maximum Value – January 1950 through Dec 2019
DISCLAIMER
All performance figures represent total returns and includes reinvestment of interest and dividends but do not reflect management fees, transaction costs, taxes, or other expenses. You cannot invest directly in indices. Future performance of these models may differ significantly from historical performance. Hypothetical performance results are presented for illustrative purposes only and should not be interpreted as an indication of future performance.
Hypothetical performance results (e.g., quantitative back tests) have many inherent limitations, some of which, but not all, are described herein. One of the limitations of hypothetical performance results is that they are generally prepared with the benefit of hindsight. In addition, hypothetical trading does not involve financial risk, and no hypothetical trading record can completely account for the impact of financial risk in actual trading. For example, the ability to withstand losses or adhere to a particular trading program in spite of trading losses can adversely affect actual trading results. The hypothetical performance results contained herein represent the application of the quantitative models as currently in effect, and there can be no assurance that the models or portfolio constituents will remain the same in the future or that an application of the current models in the future will produce similar results because the relevant market and economic conditions that prevailed during the hypothetical performance period will not necessarily recur.
The term “worst drawdown” as used on this site refers to means the maximum cumulative peak-to-valley retracement on a month-end basis. Intra-month maximum drawdowns may be substantially higher, and future maximum drawdowns may be higher still. There are numerous other factors related to the markets in general or to the implementation of any specific trading program which cannot be fully accounted for in the preparation of hypothetical performance results, all of which can adversely affect actual trading results.
1 Geczy and Samonov (2017), “Two Centuries of Multi-Asset Momentum (Equities, Bonds, Currencies, Commodities, Sectors and Stocks)”.
2 Page & Panariello, “When Diversification Fails,” Financial Analysts Journal, Mar 2018
3 Geczy and Samonov (2017), ibid.
Gary Antonacci Publiations & Research
website: https://optimalmomentum.com
blog: https://dualmomentum.net